Other List Domains [+]
- Separate list domains for faculties, departments and business units
-
Tommy Yu
Tommy Yu
CellML Discussion List
Text archives Help
- From: Alan Garny <alan.garny AT inria.fr>
- To: "cellml-discussion AT cellml.org" <cellml-discussion AT cellml.org>
- Subject: Re: [cellml-discussion] OpenCOR: new snapshot available
- Date: Wed, 29 Nov 2017 17:11:16 +0100
- Authentication-results: mx2.auckland.ac.nz; dkim=none (message not signed) header.i=none; spf=None smtp.mailfrom=alan.garny AT inria.fr
- Ironport-phdr: 9a23:+orJcRbdBTeXANgjL5qi7y3/LSx+4OfEezUN459isYplN5qZpc6zbnLW6fgltlLVR4KTs6sC0LWG9f24EUU7or+/81k6OKRWUBEEjchE1ycBO+WiTXPBEfjxciYhF95DXlI2t1uyMExSBdqsLwaK+i762wUPAQ3yPhZZIeH8G4iaz5jmlrOP4ZmbXyFkzHrjIOA6EBLj5w7css0Thc5uK7061wDSo3xOU+9bwWdtIRSUhRm2rpO78Zpn9iAVt/M6/NNbSqT9eYwzQLhcCTBgNHo6sp7Frx7GGCKL731UfWwMlAsAVwHB5Re8UZ7rtDrSt+xn2SDcM9egHuN8Yiir86o+EEygsywALTNsrTza
Dear all,
This is just to let you know that a new OpenCOR snapshot has just been
released (see here). Indeed, although there is nothing fundamentally wrong
with yesterday’s snapshot, this new snapshot is essentially the result of
some user feedback with regards to the customisation of a graph panel’s
background colour. Thus, OpenCOR can now distinguish between the background
colour of the plot area and that of its surrounding area (see issue #1473).
While at it, I noticed some minor plotting glitches on Linux/macOS, which
have been corrected (see issue #1475).
Best regards, Alan.
P.S.: feel free to spread the word and subscribe to our users (or even
developers) mailing list.
From: Alan Garny
<alan.garny AT inria.fr>
Date: Tuesday 28 November 2017 at 19:28
To:
"cellml-discussion AT cellml.org"
<cellml-discussion AT cellml.org>
Subject: OpenCOR: new snapshot available
Dear all,
This is just to let you know that a new OpenCOR snapshot has been released
(see here).
Using this snapshot, you will now be able to customise both a graph panel and
the graphs it holds, and save the whole thing in a SED-ML file / COMBINE
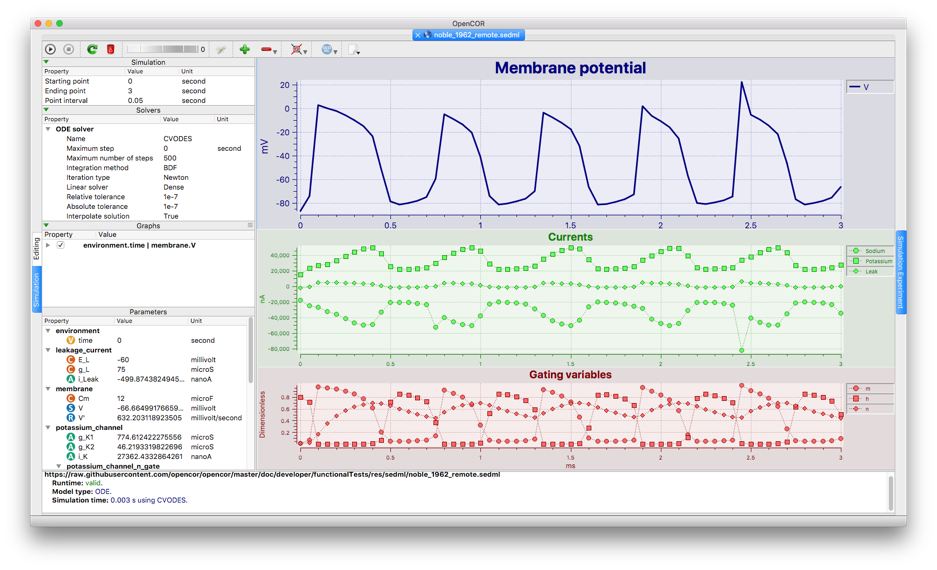
archive, and retrieve it. For example, if you open this remote SED-ML file
(using Ctrl+Shift+O) and run it, you should get something like the following
(note that the simulation output was reduced for illustration purposes):
Graph panels and graphs can be customised using the third panel from the top
on the left-hand side of the screen (the one that reads “Graphs”). You can
switch between graph panel settings and graphs settings by clicking on the
icon in the top-right of the panel. This will bring up a menu from which you
can select either “Graph Panel" or “Graphs”. From there, you will have access
to the corresponding settings. Just play around and see for yourselves.
Hopefully, you will find those settings suitable enough for your needs.
In this snapshot, it is also possible to show/hide the legend of a given
graph panel. You can do so either through the context menu of a graph panel
or through its settings (using that panel on the left). The legend consists
of clickable buttons, which when pressed down means that the corresponding
graph is visible.
This is it in a nutshell, but feel free to get in touch if something is not
clear.
Best regards, Alan.
P.S.: feel free to spread the word and subscribe to our users (or even
developers) mailing list.

- [cellml-discussion] OpenCOR: new snapshot available, Alan Garny, 11/29/2017
- Re: [cellml-discussion] OpenCOR: new snapshot available, Alan Garny, 11/30/2017
Archive powered by MHonArc 2.6.18.